Mass Percentage is pretty simple, it basically tells you how much solute is in a solution by mass. All you need to find the answer is use this formula.
It's important to remember that when finding the total mass of a solution, that you need to add together the mass of the solute and the solvent. Find some more information here (it also gets into molarity).
Solubility graphs basically tell you when a compound will be saturated, unsaturated, or supersaturated in a solution. Saturation is dependent on the temperature. For the most part, solvents can hold more solute at higher temperatures. Saturation is the point at which a solution of a substance can dissolve no more of that substance. Supersaturated solutions have more solute than can be dissolved in a solution. and unsaturated solutions have less solute than can be dissolved in a solution. If this all sounds confusing to you click here to better understand it.
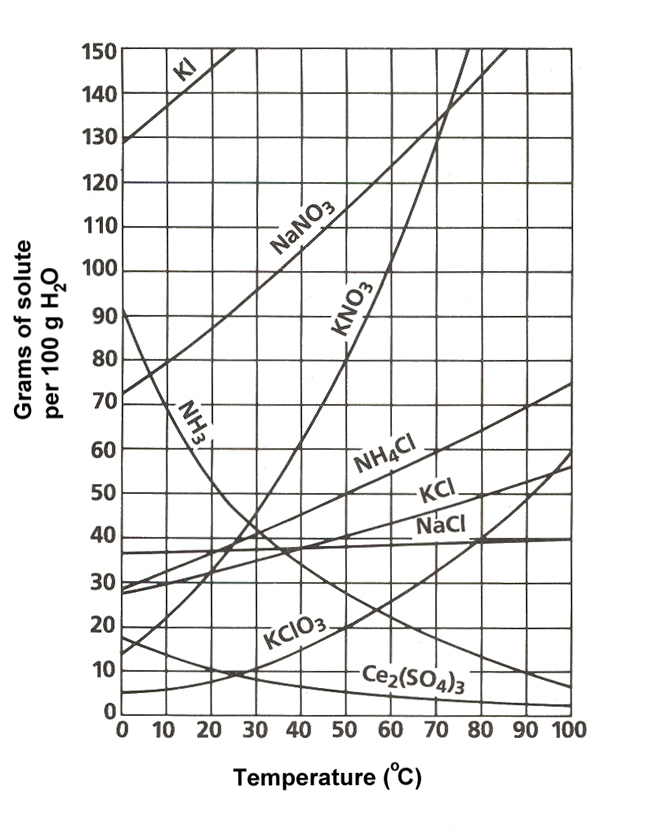
Above is a solubility graph, and as you can see, it tells you the saturation point, and that it changes depending on the temperature. With this, you are able to determine if so many grams of a compound will be saturated, unsaturated, or supersaturated in 100 grams of water at any given temperature.
No comments:
Post a Comment